An imaging expert describes the concepts and the clinical role of this new modality. SriniVas R. Sadda, MD
Although fundus autofluoresence (FAF) imaging has been an area of interest in ophthalmic research for over 40 years, it has only recently become broadly feasible clinically, due to important technological advances. Interest in FAF imaging has been driven in large part because, unlike standard reflectance imaging, FAF imaging is believed to provide an assay of outer retinal and retinal pigment epithelial function.
ORIGINS OF FUNDUS AUTOFLUORESENCE
Understanding the origin of the FAF signal in the eye requires recognition of the biology of lipofuscin. Lipofuscin accumulation is actually a hallmark of normal aging in many cells, including the RPE. In RPE cells, lipofuscin accumulation is mainly due to incomplete degradation of photoreceptor outer segments by the lysosomes. There is a cumulative effect over time; in fact, past the age of 70, over a quarter of the cytoplasmic space of RPE cells is occupied by lipofuscin and melano-lipofuscin (a product of lipofuscin and melanin). Excessive lipofuscin accumulation is believed to be pathologic and may serve as a common downstream pathogenic mechanism in various retinal degenerative disorders.
The autofluoresence signal from RPE cells is very much correlated with lipofuscin content and accumulation. FAF is increased with RPE dysfunction due to impaired processing and clearing of lipofuscin. Conversely, the FAF signal may be decreased in the setting of RPE or photoreceptor loss — if there are no photoreceptor outer segments, the source for lipofuscin formation may be lost.
It is important to recognize, however, that lipofuscin is not a single compound but is actually composed of a number of molecules, not all of which have been fully characterized. The best-described component of lipofuscin is A2E, a bis-retinoid composed of two vitamin A molecules bound together. A2E is not recognized by lysosomal enzymes, so it may accumulate in lysosomes, and it possesses toxic properties that could result in RPE cell apoptosis. There are many other components of lipofuscin, however, including peroxidation products of proteins and lipids and possibly over 10 different fluorophores.
PRINCIPLES OF AUTOFLUORESENCE IMAGING
Because of its diverse composition, lipofuscin has a broad spectrum of excitation (300-600 nm) and emission (480-800). Thus it can be excited by many wavelengths of visible light in the blue and green portion of spectrum. The intensity of the FAF emission signal returning from the RPE, however, is quite weak — generally two orders of magnitude lower than the background fluorescence of a fluorescein angiogram at the most intense part of the dye transit.
The detection of FAF is also made more challenging by the optical properties of anterior anatomical structures, in particular the crystalline lens, which is itself autofluorescent with blue light. The autofluorescent artifact produced by the lens is further magnified in the setting of nuclear sclerosis. These challenges in measuring the FAF signal initially limited its clinical feasibility and largely restricted its use to the research sphere, particularly to basic research work where intense light exposures were permissible.
The advent of confocal scanning laser ophthalmoscopic technology was an important advance in making FAF approaches clinically relevant. Confocal SLO (cSLO) utilizes a focused, low-power laser that is swept across the fundus in a raster pattern. The confocal nature ensures reflectance and fluoresence are “conjugate” (from same optical plane) and allows suppression and rejection of FAF originating from sources anterior to the retina, eg, the crystalline lens. In addition, because the lens FAF is suppressed, fundus FAF can be obtained using the same excitation (ie, blue) and barrier filters used for fluorescein angiography. This facilitated the incorporation of FAF capabilities into existing confocal SLO angiography systems and popularized blue-light as the preferred excitation wavelength for FAF imaging. FAF imaging needs to be performed prior to angiography in those systems.
Another advantage of cSLO imaging is that multiple frames may be acquired rapidly (at video rate). This permits several single FAF images to be averaged to reduce background noise and increase image contrast. This allows FAF imaging to be performed at relatively low intensities, which is critical given that high-intensity blue light is uncomfortable and potentially harmful. For most applications, anywhere from 4-16 frames are averaged, often automatically by the instrument software. This same instrument software (eg, in the Heidelberg HRA or Spectralis systems) also normalizes the pixel value distribution after calculation of the mean image. This facilitates comparison of topographic differences between individuals and facilitates qualitative comparisons, but precludes quantitative calculations of FAF intensities. Some research groups have proposed creative solutions to attempt to extract standardized, quantitative FAF intensity data, but these approaches are not yet deployed in commercial instruments.
In normal cSLO blue-light FAF imaging (Figure 1), the optic nerve head is dark (black) due to the absence of RPE (and hence no lipofuscin) and the blood vessels are also dark due to absorption of the light by blood. In the central macular area, the FAF signal is reduced by absorption of blue light by luteal pigment. These characteristics of normal blue-light FAF must be considered when evaluating for the presence of abnormal fluorescence. The luteal pigment–related foveal hypofluorescence also complicates assessment of FAF abnormalities involving the fovea.
LIMITATIONS OF FUNDUS AUTOFLUORESENCE
Despite the many potential clinical applications of FAF imaging, there are some limitations that should be considered when assessing FAF data and using the information in the care of patients. First, the optimal protocols for acquisition need to be defined and standardized — differences in acquisition technique could affect the findings. Second, FAF is sensitive to media opacity. Third, alterations in FAF may occur due to dynamic processes, including circadian rhythms, level of dark adaptation, and photoreceptor bleaching. Finally, quantification of absolute intensities is not yet possible in commercial FAF systems.
SUMMARY
Fundus autofluorescence is a noninvasive, rapid and potentially useful imaging modality that continues to evolve. FAF reflects metabolic changes in the RPE and thus provides an assay of retinal and RPE function. FAF imaging appears to have an important role in the diagnosis of retinal dystrophies and an increasing role in monitoring disease progression in patients with atrophic AMD.
Bron: Fundus Autofluoresence Imaging: Principles and Applications
De Lairessestraat 59 1071 NT Amsterdam 020-679 71 55 omca@me.com www.omca.nl

A variety of different diseases can result in abnormal FAF in the posterior pole, but most can be grouped into one of four categories:
-
(1) change in the amount of composition of lipofuscin in the RPE,
-
(2) presence of absorbing or auto-fluorescent material anterior to the RPE,
-
(3) abnormal tissue with fluorophores similar to the RPE lipofuscin at the level of the choroid or
(4) media opacities.
CLINICAL APPLICATIONS
Major current clinical applications of FAF fall into three categories: noninvasive diagnosis, monitoring disease progression and explaining visual loss.
Below are some of the most common conditions in which FAF can play a role.
Retinal Dystrophies
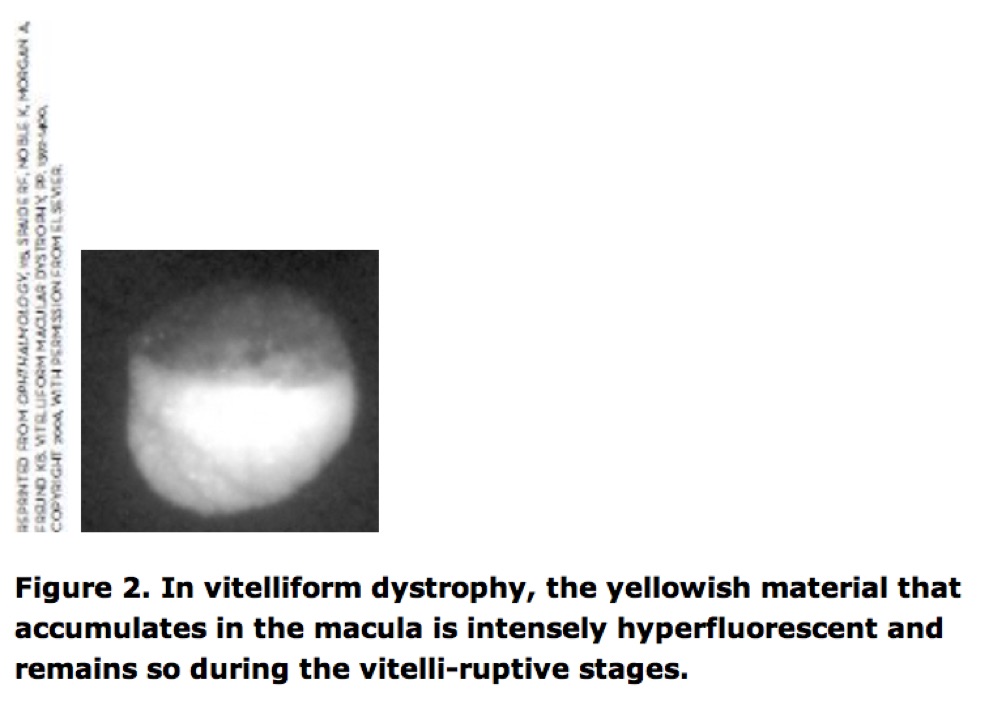
Retinal dystrophies are a class of diseases for which FAF imaging has been particularly valuable. Patients with vitelliform dystrophy (Best's disease) have characteristic FAF abnormalities that are virtually pathognomonic and may aid in diagnosis in questionable cases. The yellowish material (“egg-yolk”) that accumulates in the macula is intensely hyperfluorescent (Figure 2) and remains so during the vitelli-ruptive stages. In advanced Best's disease, when atrophy ensues, well-demarcated areas of decreased AF may be observed.
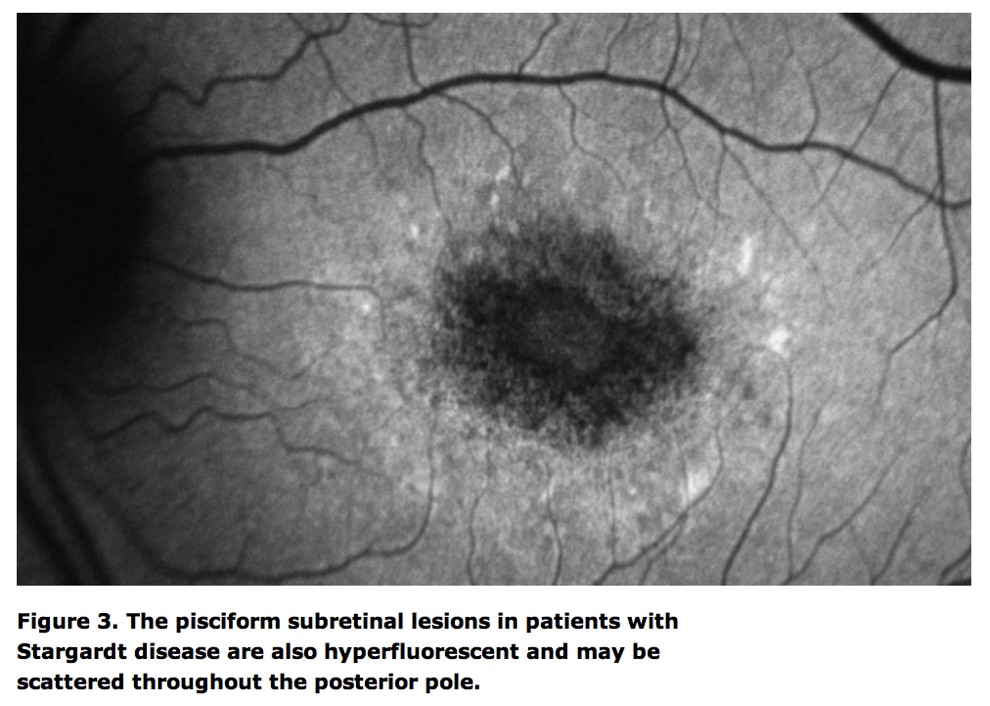
Patients with Stargardt disease, the most common type of macular dystrophy in young patients, also have a characteristic appearance (Figure 3). The pisciform subretinal lesions in these patients are also hyperfluorescent and may be scattered throughout the posterior pole.
However, unlike patients with pattern dystrophies of the RPE, which can have similar-appearing lesions, the hyperfluorescent lesions in Stargardt patients typically spare the peripapillary and nasal retina — however, this distinction is not absolute. Stargardt patients will also typically have areas of decreased AF centrally due to RPE atrophy.
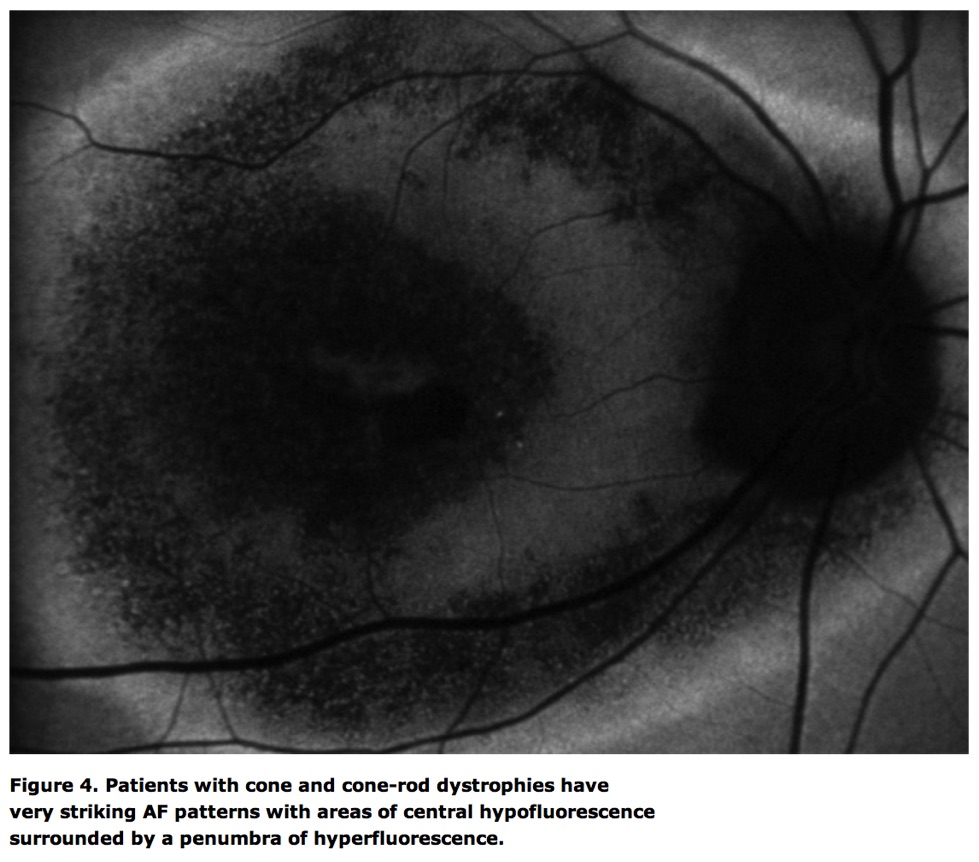
Patients with cone and cone-rod dystrophies have very striking FAF patterns with areas of central hypofluorescence surrounded by a penumbra of hyperfluorescence (Figure 4).
The areas of decreased AF represent areas of dead or absent RPE, whereas the ring of increased AF is thought to represent the active edge of dysfunctional or injured photoreceptors.
The inversed pattern is observed in patients with rod-cone degenerations with peripheral decreased AF and with increased AF at the posterior margin.
Macular Telangiectasis. Idiopathic parafoveal telangiectasis (IPT) type 2 is another condition with very characteristic FAF findings. Previously, IPT 2 was deemed to be a primary retinal vascular disease with subsequent secondary retinal neuronal damage.
Recent observations, including FAF findings, however, suggest that retinal neuronal changes may be a component of the primary pathogenic process. Patients with IPT have depletion of macular luteal pigment, which manifests as loss of the normal foveal hypofluorescence on FAF imaging.
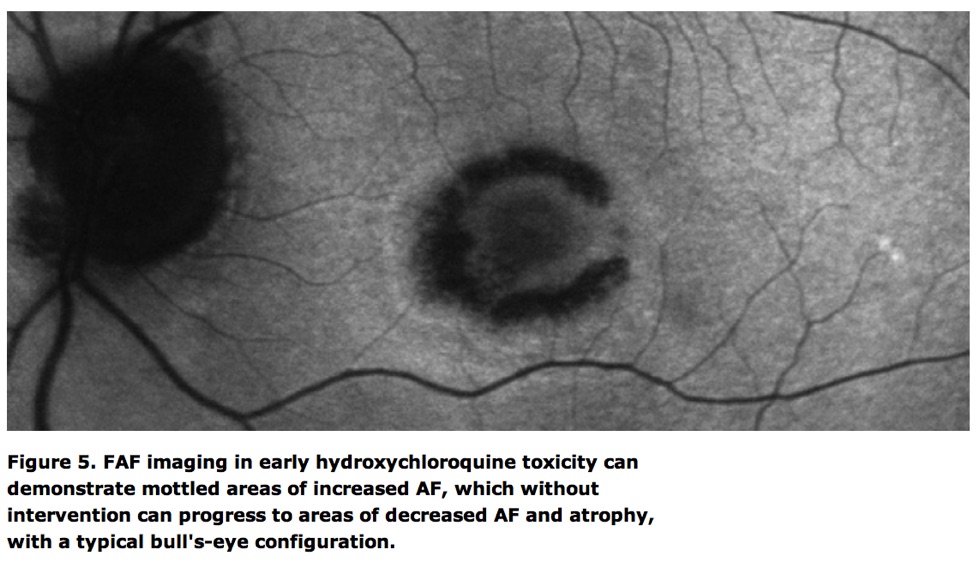
Pharmacologic Toxicity. Detection of early evidence of hydroxychloroquine (Plaquenil, Sanofi-Aventis) toxicity is crucial to avoiding significant vision loss. Traditionally, components of hydroxychloroquine screening have included red-on-white perimetry and color-vision testing. Recently, screening guidelines have been updated to include consideration of spectral-domain optical coherence tomography and FAF imaging.
FAF imaging in patients with early hydroxychloroquine toxicity can demonstrate mottled areas of increased AF (signifying injured RPE cells), which without intervention (ie, cessation of the drug) can progress to areas of decreased AF and atrophy, with a typical bull's-eye configuration (Figure 5).
Age-related Macular Degeneration. Because of the high prevalence of disease, the most important clinical application of FAF imaging is in the assessment of patients with dry (non-neovascular) AMD. Although stereo color fundus photography has been the traditional gold standard for documenting and staging patients with dry AMD, FAF has been advanced as a superior method due to the high contrast that it provides, identifying areas of RPE loss. Measurements of atrophy (evident on FAF imaging as well-demarcated patches of decreased AF) by FAF have been shown to be reproducible, and progression of atrophy as determined by FAF imaging has suggested a suitable endpoint for registration of clinical trials for new dry AMD therapeutics.
Measurement of atrophic lesions is not the only application of FAF imaging in patients with dry AMD. These lesions are often surrounded by additional AF abnormalities, including areas of hyperautofluoresence, which may organize in a variety of patterns. Diffuse AF abnormalities in this junctional zone (ie, around atrophic lesions) or bands of increased AF around the perimeter of the atrophic lesion have been shown to be risk factors for more rapid progression of atrophic lesions. As a result, recognition of these high-risk patterns is now an important component for selecting patients for enrollment in clinical trials of new nonexudative AMD pharmacotherapies.
NEW INNOVATIONS IN FAF IMAGING
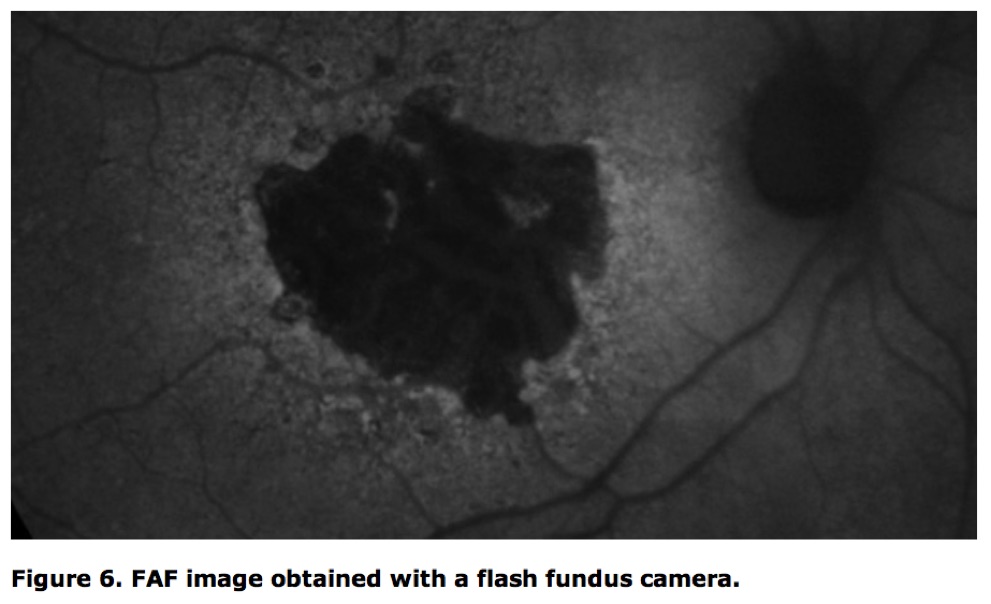
As noted above, the confocal blue-light SLO approach has been established as the most common modality for acquiring the FAF signal. This approach, however, requires that the ophthalmologist have an SLO instrument, which may be an expensive proposition. More recently, Spaide et al. have demonstrated that traditional flash fundus cameras can be equipped with special filters to produce an FAF image. To reduce contribution/interference from the crystalline lens, flash-camera–based autofluoresence depends on excitation in the green portion of the spectrum. The FAF images obtained with a flash fundus camera can be of very good quality (Figure 6), though the patterns of abnormal AF may differ compared with blue-light SLO systems. These differences are likely in large part due to excitation of different fluorophores within the lipofuscin.
Another important recent innovation in FAF imaging is the adaptation of widefield fundus imaging systems, such as the Optos 200Tx, to perform autofluoresence imaging. Although it is an SLO system, the Optos FAF acquires images using green light, similar to flash-camera FAF.
Recently, we have observed that peripheral AF abnormalities are quite common, present in over 70% of patients in a recent series at our institute.
The clinical significance of these findings, however, is still uncertain.
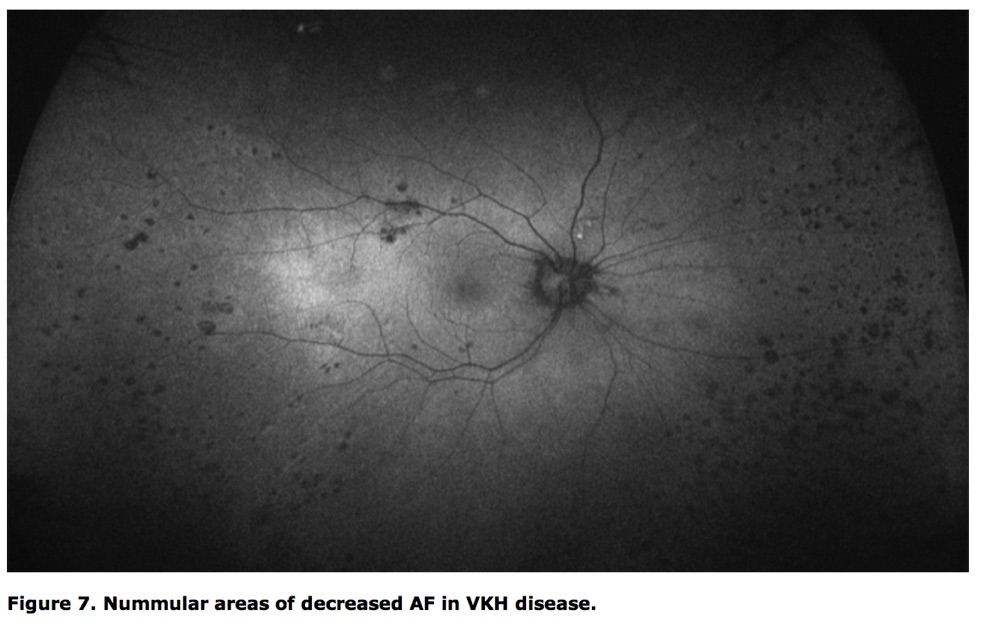
Peripheral FAF findings appear to be quite characteristic in some disorders, such as chronic Vogt-Koyanagi-Harada disease, which typically shows numerous nummular areas of decreased AF (Figure 7).
The significance of peripheral AF abnormalities in patients with AMD will be explored further in the AREDS2 study.
Green light is not the only alternative wavelength for FAF imaging. An AF signal from the retina can also be acquired using near-infrared light, similar to the wavelengths (eg, 787 nm) used for indocyanine green angiography.
Near-infrared autofluoresence (NIA) appears to correspond to melanin (present in the RPE as well as the choroid) rather than lipofuscin.
As such, it provides a different type of information, which may be complementary to short-wavelength (blue-or green-light) FAF. The clinical utility of NIA, however, remains to be demonstrated.


Amsterdam Eye Hospital
Oogziekenhuis Amsterdam

