Optical coherence tomography
The Stratus OCT also uses light to measure RNFL thickness, but follows a different principle than the GDx VCC. Whereas the GDx VCC uses the birefringent properties of the retina to determine RNFL thickness, the OCT is more like a B-scan ultrasound that uses light to detect slight differences in refractive index.
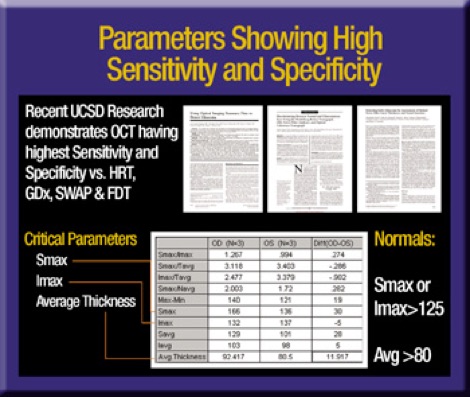
Published reports show the Stratus OCT has the highest sensitivity and specificity for detecting RNFL defects compared to SWAP, FDT and HRT.1-3 Nevertheless, we always must account for software- and patient-based artifact when interpreting OCT scans.
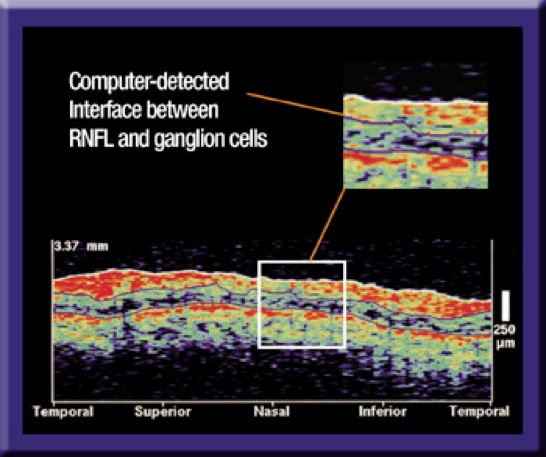
For example, the Stratus OCT uses a complex algorithm to calculate and insert an interface line between retinal ganglion cells and the overlying RNFL. If this line appears to jump to an area of the retina that's incongruous with the rest of the TSNIT plot you should question the accuracy of the result.
Poor patient fixation, incomplete raw scan data and poorly centered scans are other factors you should consider while interpreting OCT results. Nevertheless, I think the Stratus OCT is the best available technology to evaluate glaucoma-related RNFL changes.
Integrating the results
My favorite instrument for diagnosing glaucoma is still the +60D lens, but I've made room for new imaging technologies in my practice. SWAP and the Humphrey Matrix help me detect early visual field loss, just as HRT, GDx VCC and OCT help me identify glaucoma-related RNFL changes.
Of course, the more devices you use to examine a patient, the more likely you'll get conflicting results. Keep in mind that a single aberrant result doesn't change the whole picture, just as conclusive results warrant immediate treatment. As always, being alert and informed is the most important factor in the diagnostic equation, no matter how many diagnostic tests you use.
Dr. Mills is a clinical professor of ophthalmology at the University of Washington in Seattle.
You have all the tools you need to detect early signs of disease.
Here's how you can use them to benefit you and your patients.
By Richard P. Mills, M.D., M.P.H
Diagnosing glaucoma used to be a simple matter of identifying patients with elevated IOPs. Recently, we've developed a more complex diagnostic approach that integrates data from landmark clinical studies with evidence from advanced imaging technologies. We still measure IOP and perform visual field testing, but we also document family and past medical history. We also use more sensitive functional testing to evaluate the optic nerve and the retinal nerve fiber layer (RNFL). As a result, we can diagnose glaucoma earlier, start treatment sooner and achieve better outcomes. The first step in this process includes comprehensive visual field testing.
Functional testing: SITA and SWAP
Visual field testing is a valuable tool for measuring functional loss secondary to glaucoma. Even if you plan to evaluate patients with other visual field modalities, every glaucoma suspect or patient should complete a 24-2 full-threshold or Swedish Interactive Threshold Algorithm (SITA) test. This test, which uses white-on-white perimetry to detect visual field defects, remains the gold standard for glaucoma care.
Short-wavelength automated perimetry (SWAP), also known as blue-on-yellow perimetry, can detect visual defects earlier than tests that use white-on-white stimuli. Good candidates for SWAP include:
► Young patients with ocular hypertension. Perhaps the perfect population for SWAP, these reliable observers have good reaction times and are less likely to have cataracts that block SWAP stimuli.
► Pseudophakic patients with ocular hypertension. These elderly, post-cataract surgery patients get excellent results with SWAP because their IOLs are unobstructed by yellow-tinted cataracts.
► Patients with incongruous test results. SWAP can detect visual defects in patients who have normal visual fields on standard perimetry but questionable discs on clinical examination. Blue-on-yellow perimetry can provide visual field evidence that's more consistent with disc appearance.
SWAP does have some disadvantages. Because nuclear sclerosis can depress overall visual fields, SWAP is more likely to detect focal defects than generalized defects in phakic patients. Long test time, especially in full-threshold mode, is another downside of this technology, although a new SITA version of SWAP performs the same test in one-third the time. Finally, we must give patients the opportunity to adapt to the bright yellow background after switching the eye patch from one eye to the other.

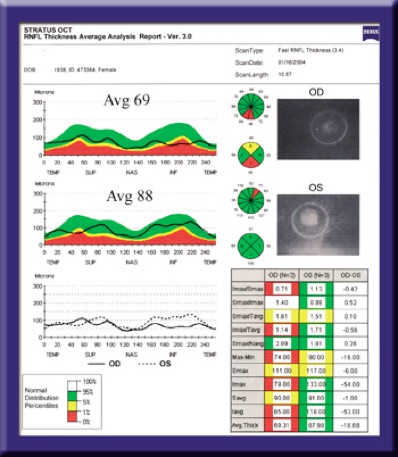
Superimposing TSNIT scans from opposite eyes helps us detect optic disc asymmetry, a common indicator of early glaucoma. Critical parameters shown in this Stratus OCT printout include the superior maximum (Smax), inferior maximum (Imax) and average retinal thickness.

Frequency doubling perimetry
Another technology that detects visual defects earlier than white-on-white perimetry is frequency-doubling technology (FDT) perimetry. This test, which uses alternating black and white stripes to measure spatial contrast sensitivity, stimulates the small subpopulation of retinal magnocellular (MY) ganglion cells. Because MY cells are less numerous than other types of retinal cells, FDT perimetry easily detects damage, even when only a small percentage of the total population of MY cells is affected.
The most recent FDT perimetry test is the Humphrey Matrix. The newly upgraded Matrix presents smaller targets (5 degrees vs. 10 degrees) in a pattern similar to white-on-white perimetry. Video eye monitoring and redesigned optics provide a wider field of vision with 30-2 or 24-2 patterns. The Matrix is useful for detecting visual field loss in ocular hypertensives with normal SITA fields; patients with abnormal discs and normal SITA fields; and patients with nonglaucomatous or scattered visual defect patterns on SITA.
Evaluating structure
Continuing advances in visual field testing are helping us diagnosis glaucoma earlier, but an even more reliable indicator of early disease is optic disc and RNFL morphology.
Because they emphasize pallor over physical cupping, monoscopic examination techniques, such as direct and indirect ophthalmoscopy, provide limited information about optic disc cupping. In contrast, stereoscopic examination with a handheld +60D, +78D or +90D lens, a Hruby lens or a Goldmann contact lens provides a more three-dimensional view of the posterior segment. Pallor is still a concern, but you can accurately assess optic nerve cupping by concentrating on detecting physical changes.
Comprehensive clinical examinations also should include optic disc photography. However, sequential stereoscopic photography can have a variable base, inconsistent depth perception and variability in the Z-axis secondary to patient movement.
Despite these shortcomings, stereoscopic photography remains an important, and until recently, the only method for documenting optic nerve changes. Fortunately, new imaging technologies are helping us detect and track subtle structural changes in the optic disc and RNFL.
Scanning laser ophthalmoscopy
The Heidelberg Retina Tomograph (HRT) (Heidelberg Engineering) uses confocal scanning laser ophthalmoscopy to create a three-dimensional image of the optic nerve and retina. The HRT is a good diagnostic tool for any ophthalmologist, but I would recommend it for non-glaucoma specialists who are less familiar with the subtle optic disc changes that indicate early glaucoma. The HRT produces a high-resolution topographic map that shows generalized cup enlargement, focal neuroretinal rim notching or superficial splinter hemorrhage, all of which physicians may otherwise miss with traditional clinical examination techniques.
Scanning laser polarimetry
The RNFL isn't just the earliest optic structure to show glaucomatous change — it's also the most difficult to evaluate. We sometimes can visualize RNFL defects on stereoscopic disc photography, but two relatively new technologies provide more reliable results.
The Stratus OCT uses slight differences in refractive index to identify the interface between the retinal nerve fiber layer (RNFL) and the underlying ganglion cell layer.
The GDx VCC estimates RNFL thickness by measuring the phase shift of polarized light as it passes through the retina.
A variable corneal compensator (VCC) removes the part of the signal generated by the anterior segment as it scans each eye, improving the sensitivity and specificity of the final result.
GDx VCC polarimetry scan reports include corneal polarization parameters; temporal-superior-nasal-inferior-temporal (TSNIT) plots overlaid by normative values; and nerve fiber indices based on clinical data. The higher the nerve fiber index on a scale of 1 to 99, the more likely the patient has glaucoma. Superimposed TSNIT scans from both eyes also illustrate nerve fiber index.


De Lairessestraat 59 1071 NT Amsterdam 020-679 71 55 omca@me.com www.omca.nl


Amsterdam Eye Hospital
Oogziekenhuis Amsterdam

