Digital Imaging


Diagnostic digital imaging has become a powerful new tool in glaucoma diagnosis and management. Computerized measurement of optic disc structure/size/area, cup size/volume, retinal nerve fiber layer thickness, and macular thickness provide a detailed analysis of the optic disc and retina.
Up to 40% of a person’s nerve fiber layer can be lost before any subjective visual field loss is clinically detectable using visual field testing.
A new generation of digital instruments holds promise for making glaucoma detection more sensitive so that treatment can begin before significant nerve fiber damage has occurred.
GDx VCC - Nerve Fiber Layer Analyzer (Laser Diagnostic Technologies)
This instrument uses low-intensity polarized light to measure the thickness of the nerve fiber layer and then it compares the patients data with an internal statistical database.
The Variable Corneal Compensator (VCC) in the instrument adjusts for corneal stromal fiber polarization in the calculation of the nerve fiber layer thickness, thus providing a baseline measurement.
A new baseline is required if corneal thickness changes due to LASIK or other reasons.
The instrument determines the nerve fiber thickness in a ring around the disc margin. In normal patients, the result is a double humped curve with the humps indicating the increased thickness in the superior and inferior regions of the retina.
In a glaucoma patient, the humps are flattened indicating nerve fiber layer atrophy. The instrument also uses a statistical program to assign a number between 0 and 100 indicating the probability that the patient has glaucoma.
The higher the number, the more likely glaucoma is present.
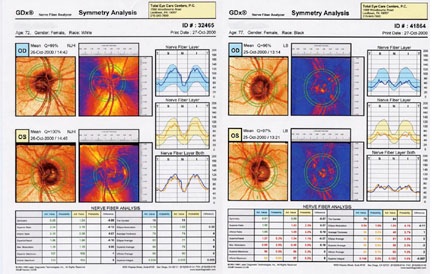
GDx VCC Nerve Fiber Layer Analyzer.
GDx printout of a normal patient (L) and a patient with glaucoma (R).
Note flattening of the thickness curves (lower right) for the patient with glaucoma due to superior and inferior nerve fiber thinning.
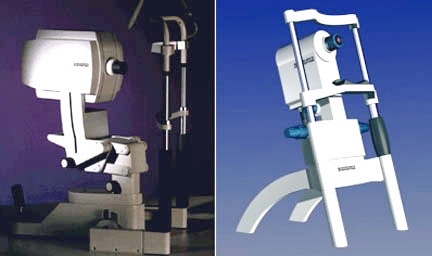
HRT - Heidelberg Retinal Tomograph (Heidelberg Engineering)
Two types of instruments are available – the HRT and HRT II Models. The instruments use scanning laser deviations that produce retinal and optic nerve head elevation/depression maps. The HRT II can be adapted to provide vascular flowimetry data of the optic nerve as well.
Many parameters are calculated using HRT data. Optic disc parameters include rim area and volume, disc area and volume, and c/d ratio. The mean nerve fiber thickness at the disc margin is also calculated.
The surface area of the rim tissue is one parameter that is closely associated with a glaucoma diagnosis. This matches what is seen using ophthalmoscopy. As glaucoma progresses, neurons on the inside of the rim atrophy and the rim tissue thins. This results in less surface area being visible.
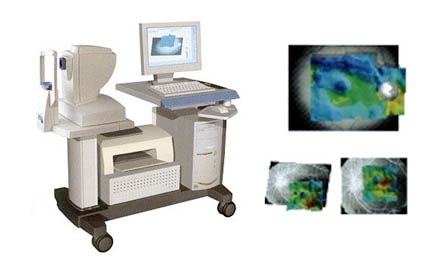
RTA - Retinal Thickness Analyzer (Talia Technologies)
Like the HRT, the RTA uses scanning laser deviations that are translated into retinal and optic nerve head elevation/depression maps. To determine glaucomatous damage, the RTA measures retinal thickness of the central 20 degrees of the fundus. This area contains 50% of the retinal ganglion cells, which make up around 30% of the total retinal thickness. Loss of ganglion cells and nerve fibers are reflected in decreased retinal thickness.
Figure 29. RTA (L), RTA image capture examples (R).
OCT - Optical Coherence Tomography
This instrument utilizes Michelson interferometry to create a very detailed cross sectional image of the disc and retinal layers, similar to an image created by ultrasound.
The thickness of the retinal nerve fiber layer in the peripapillary region is compared to a database of thicknesses from normals. In addition, the OCT analyzes changes in the retinal nerve fiber layer from one exam to another.
Because of the cross sectional nature of the image, this instrument measures not only the thickness of retinal tissue but it can also assess changes in the tissue. This is very useful for assessing macular disease such as cystoid macular edema and macular holes.
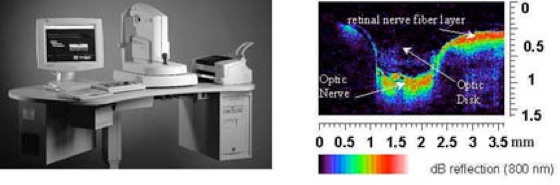
OCT (L), OCT image capture example (R).
De Lairessestraat 59 1071 NT Amsterdam 020-679 71 55 omca@me.com www.omca.nl


Amsterdam Eye Hospital
Oogziekenhuis Amsterdam